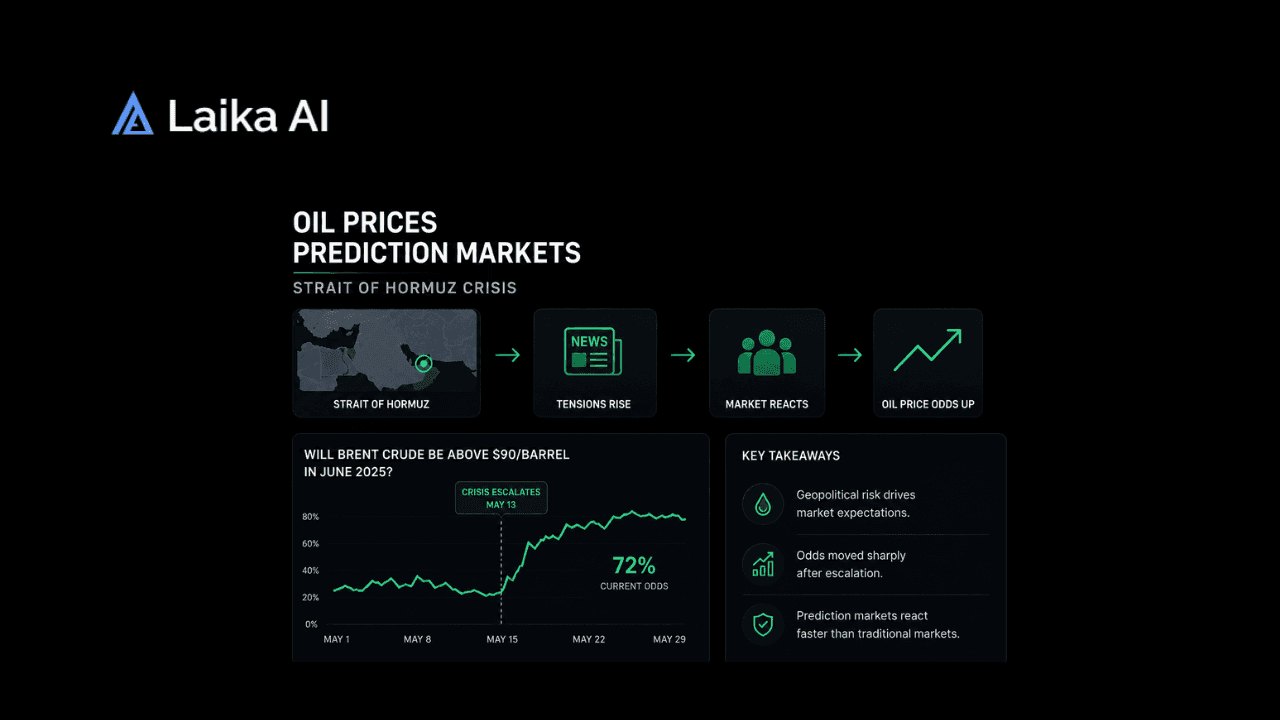
A polymarket oil price contract is usually a quiet corner of the site. Not this year. Since February, it has become one of the more closely watched trading venues in the world, tracking a war that has pushed Brent crude from the low $70s to nearly $120 and back down more than once.
Every polymarket oil price prediction tied to this conflict has effectively become a referendum on one narrow question: does shipping through the Strait of Hormuz get back to normal, and when. That's a strange amount of weight to put on a single chokepoint, but it's also exactly why traders keep watching it.
This piece walks through how the Strait of Hormuz crisis actually moved these markets, what Kalshi and Polymarket traders are pricing right now, and what the gap between the two platforms' odds tells anyone using prediction markets to think about oil risk. For background on commodity trading through these platforms generally, Commodity Prediction Markets 2026: Trading Oil, Gold & Grain Prices covers the wider category beyond just this one crisis.
How the Crisis Started
The US and Israel launched joint military strikes against Iran on February 28, 2026, a Saturday, so oil markets weren't even trading yet. Brent crude sat at $71.32 a barrel on February 27. By March 2, the first trading day after the strikes, it had jumped to $77.24. An 8% move in two sessions.
The strikes reportedly killed several senior Iranian officials, including the country's longtime supreme leader. Iran responded fast, hitting infrastructure across the Gulf. Then, on March 4, Iranian forces declared the Strait of Hormuz closed and began attacking ships that tried to pass through anyway. Roughly a fifth of the world's crude oil normally moves through that waterway. Cutting it off, even partially, was never going to be a small story for prices.
Traffic all but stopped. UK Maritime Trade Operations reported as few as five ships passing through daily in the weeks after the strikes began, against a pre war average of 138. Brent broke $100 within two weeks and kept climbing from there, eventually touching close to $120 at its peak in March, a monthly gain of over 50%, one of the largest on record. Goldman Sachs revised its own 2026 Brent forecast upward twice during this stretch, first to $85 and then higher still as the disruption dragged on. The Congressional Research Service tracked the early price action directly, and the full report sits at congress.gov for anyone who wants the primary numbers rather than a secondhand summary.
This is roughly the moment a polymarket oil price and Kalshi oil price contract stopped being a niche curiosity and started functioning as a genuine barometer for how bad traders thought things would get. Volume on both platforms' Iran related markets climbed sharply through March and April, well before either site had built out the fuller menu of contracts they run today.
Kalshi's Hormuz Market
Kalshi ran his own version of this question well before things calmed down anywhere. The contract asks whether Strait of Hormuz traffic returns to a defined normal, using IMF PortWatch's seven day rolling average of transit calls as the resolution source rather than anything Kalshi calculates on its own.
By late April, with a ceasefire extended but nothing settled on reopening the Strait, Kalshi traders priced just a 42% chance of normal traffic by June 1. That crept up to 59% for July 1 and 61% for August 1, tracking the slow, uneven back and forth between Washington and Tehran rather than any single dramatic breakthrough.
Worth flagging directly: CNBC has disclosed a commercial relationship with Kalshi, including a minority investment, and that disclosure runs on CNBC's own Kalshi coverage. It doesn't mean the numbers are wrong. It does mean the relationship exists, and readers should know that going in.
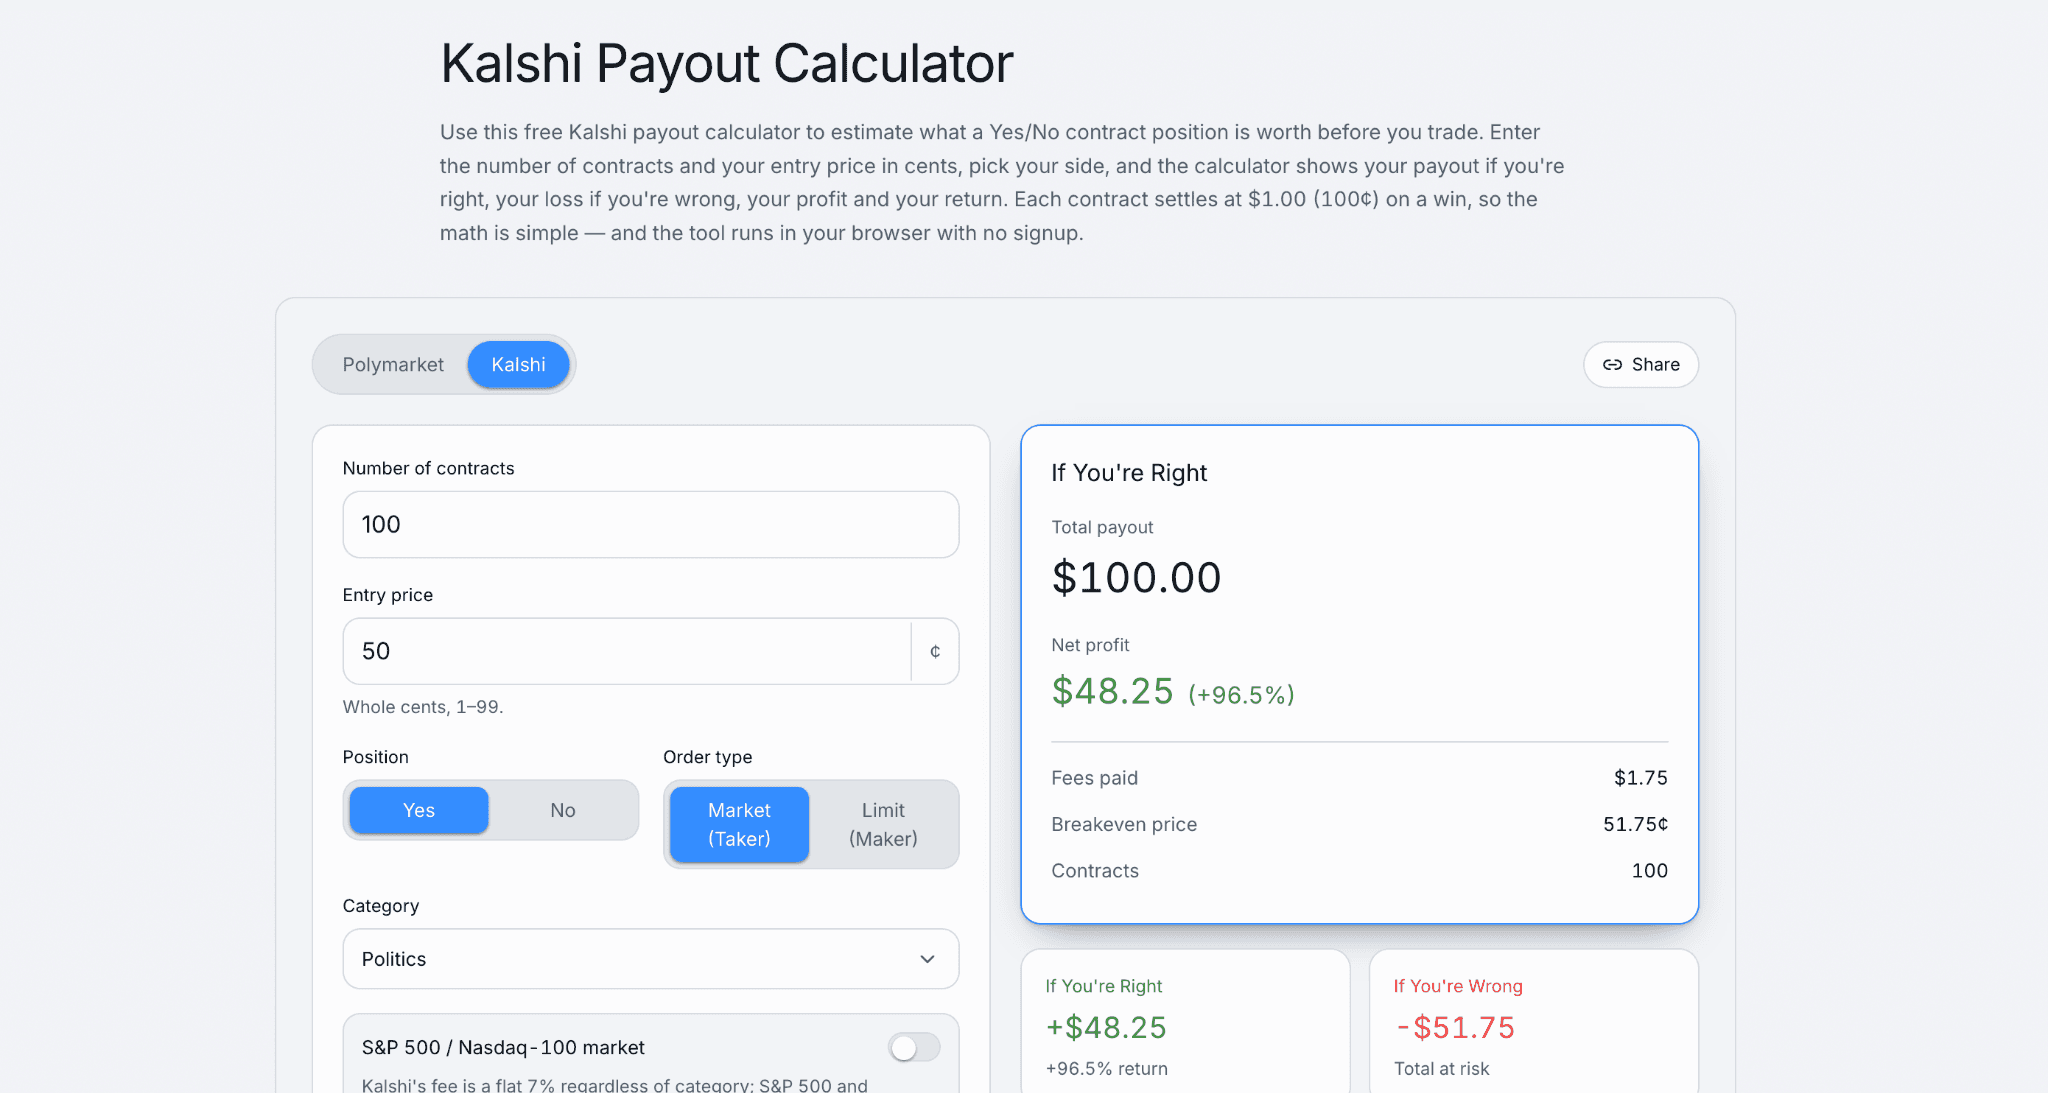
Kalshi's oil price and shipping data both trace back to the same underlying source, viewable directly at portwatch.imf.org.Try the Kalshi Payout Calculator to estimate your returns before every trade and make more informed trading decisions.
Polymarket's Parallel Bet
Polymarket ran the identical question through its own market, same IMF PortWatch resolution source, different pool of traders. And the odds diverged in places, which is itself informative. A polymarket oil price prediction built on the same underlying data as Kalshi's can still land somewhere different, simply because the two platforms draw from different trader bases with different risk appetites.
In that same late April window, Polymarket had traders at 45% for normal traffic by the end of May and 67% by the end of June, both somewhat more optimistic than Kalshi's numbers for comparable dates. Then June happened. A US Iran memorandum of understanding landed mid month, sanctions waivers followed, and for about two weeks it genuinely looked like the worst was over. Brent slid to $78.24 on June 17, its lowest since early March.
It didn't hold. On June 25, Iran's navy warned it was "unacceptable and dangerous" for ships to transit without Tehran's direct approval, deal or no deal. A vessel was attacked the following day, forcing a UN agency to pause its own evacuation planning for stranded ships. Polymarket's numbers moved accordingly, and a broader picture of how these markets treat the wider conflict, not just shipping specifically, is covered in Iran Polymarket Odds 2026: War Risk and Market Analysis.
What the Odds Actually Show Right Now
As of July 26, 2026, the picture is genuinely split depending on which specific contract you're looking at, and the difference matters more than a single headline number would suggest.
That first row is the one worth sitting with. Traders are pricing less than a 1 in 10 chance the Strait normalizes in the next five days, despite a nominal US Iran framework still technically on the table. Persistent security risk, de-mining requirements, and elevated insurance premiums are keeping vessel counts far below pre war levels even during quieter stretches. Meanwhile the Strait of Hormuz odds on the slightly longer August 31 contract sit almost exactly at a coin flip, which tells you traders think a resolution is plausible, just not fast.
It's worth noting how much these numbers have moved since April, and in which direction. Back then, both a Kalshi oil price watcher and a Polymarket trader would have seen odds trending upward, toward normalization, through May and June. The late June attack reversed that trend hard, and the war's continuation into late July reversed it further still. Anyone reading only the April data, or only the mid June optimism, would have walked away with a badly outdated picture of where things actually stand today.
The war itself hasn't cooled either. As of late July, US forces had carried out thirteen consecutive nights of strikes on Iran, and Brent had crossed back above $100 after tanker attacks reported off Saudi Arabia. Oil was on track for close to a 14% weekly gain by July 24, and the Caspian Pipeline Consortium had suspended crude loadings at its Black Sea terminal after separate tanker attacks disrupted a large share of Kazakhstan's oil exports, a reminder that this conflict has started rippling into supply chains well outside the Gulf itself. Anyone treating the June de escalation as the end of the story would have been badly wrong within weeks. For the fuller trading picture around these swings, Iran War Markets on Polymarket: What Traders Need to Know Before Placing Bets covers positioning strategy specifically for this kind of on again, off again conflict.
Reading a Strait of Hormuz Prediction Market
A strait of the Hormuz prediction market isn't really betting on a war ending. It's betting on a very specific, verifiable data point, whether IMF PortWatch's shipping data crosses a defined threshold by a defined date. That's a narrower question than "does the war end," and it can move independently of ceasefire headlines in ways that catch people off guard.
Take the whiplash between mid June and late June as the clearest example. A framework deal, sanctions relief, and genuine ship movement all happened within days of each other, and the market responded by pricing in real optimism. Then a single attack on a single vessel undid a meaningful chunk of that. Shipowners don't resume normal operations after one attack under a fresh deal. Insurance underwriters don't either. The contract tracks that caution directly, sometimes faster than headline coverage does. Polymarket's broader Iran category, which now spans well over a hundred separate markets, includes related contracts like whether Kharg Island remains under Iranian control, giving traders a way to price out individual pieces of the conflict rather than just the war as a whole. For a look at how traders have handled the political side of this conflict specifically, Polymarket Traders Are Pricing a Leadership Crisis in Iran covers the succession and internal stability angle that's been running alongside the shipping story this whole time.
Why Traders Use This as a Hedge
Oil exposure through a brokerage account is clunky. Futures require margin accounts and contract sizes most retail traders don't want to deal with, and ETFs carry tracking error and rollover costs that eat into a short term hedge. A Yes or No contract on shipping traffic, by contrast, costs whatever you put in and pays out cleanly.
That simplicity is exactly why some traders have started treating these markets as a kind of insurance against portfolio exposure to energy prices, airlines, or shipping stocks, all of which move on Hormuz headlines whether or not the trader ever intended to bet on Middle East geopolitics directly. Geopolitical Hedging 101: Using Prediction Markets as Portfolio Insurance covers that strategy in more depth, including the limits of using an event contract as a substitute for a real hedge.
Beyond Oil
Shipping and crude prices aren't the only things reacting to this war. Kalshi's own recession odds, tracked separately from the Hormuz contract, spiked to nearly 37% at the end of March before easing back under 26% as the immediate panic faded, a reminder that traders were pricing broader economic fallout, not just barrel prices, during the worst weeks of the conflict.
Equity markets have felt some of this too, even if less directly. For traders who want to extend this kind of event-driven thinking beyond commodities specifically, How to Use Prediction Markets to Gauge S&P 500 Event Sentiment covers how the same logic applies to broader market sentiment, not just oil.
The Bottom Line
A polymarket oil price contract on Strait of Hormuz traffic isn't a perfect predictor. It's a snapshot of what a specific pool of traders, risking real money, currently believes about a very specific, checkable outcome. Right now that snapshot shows deep skepticism about a near term resolution and rough coin flip odds on something a month further out.
Whether that turns out right is genuinely unknowable from here. What is knowable is that these markets moved faster than most headlines did through June's whiplash, and they're likely to keep doing that as the war grinds on. Worth watching. Not worth mistaking for a guarantee.
FAQs
How does Polymarket predict oil prices?
Polymarket doesn't predict oil prices directly the way a forecast model would. Instead, traders buy and sell Yes/No shares on specific, verifiable outcomes, like whether Strait of Hormuz shipping traffic returns to a defined normal by a set date, and the resulting share price reflects the market's aggregated view of that probability. Since oil prices react heavily to shipping disruptions through the Strait, these contracts function as an indirect but closely watched proxy for oil price risk.
What are Kalshi's oil price markets?
Kalshi oil price exposure runs mainly through its Strait of Hormuz shipping contracts rather than a direct barrel price market. The flagship contract asks whether traffic through the Strait returns to normal, defined using IMF PortWatch's seven day transit call average, by a specific deadline, with odds moving alongside real world negotiations and shipping data.
Is there a prediction market for the Strait of Hormuz?
Yes. Both Kalshi and Polymarket run active straits of Hormuz prediction market contracts, both resolving against the same IMF PortWatch shipping data. Polymarket currently lists multiple overlapping windows, including contracts for traffic normalizing by July 31 and by August 31, while Kalshi runs its own version targeting a September 1 deadline.
What are the current odds on the Strait of Hormuz traffic normalizing?
As of late July 2026, the strait of Hormuz odds vary sharply by deadline. Polymarket's July 31 contract sits around 8.5% Yes, reflecting deep skepticism about near term normalization, while its August 31 contract sits close to a 50/50 split. Kalshi's comparable September window has run in a similar mid range, tracking the on again, off again nature of US Iran negotiations rather than a single clear trend.
How does Kalshi track Hormuz shipping traffic?
Hormuz Kalshi odds and Kalshi's broader shipping contracts both resolve using IMF PortWatch data specifically, the same seven day rolling average of vessel transit calls through the Strait that Polymarket also relies on. Neither platform generates its own shipping data. Both defer to that single, independently published source, which is part of why their odds, while not identical, tend to move in the same general direction over time.