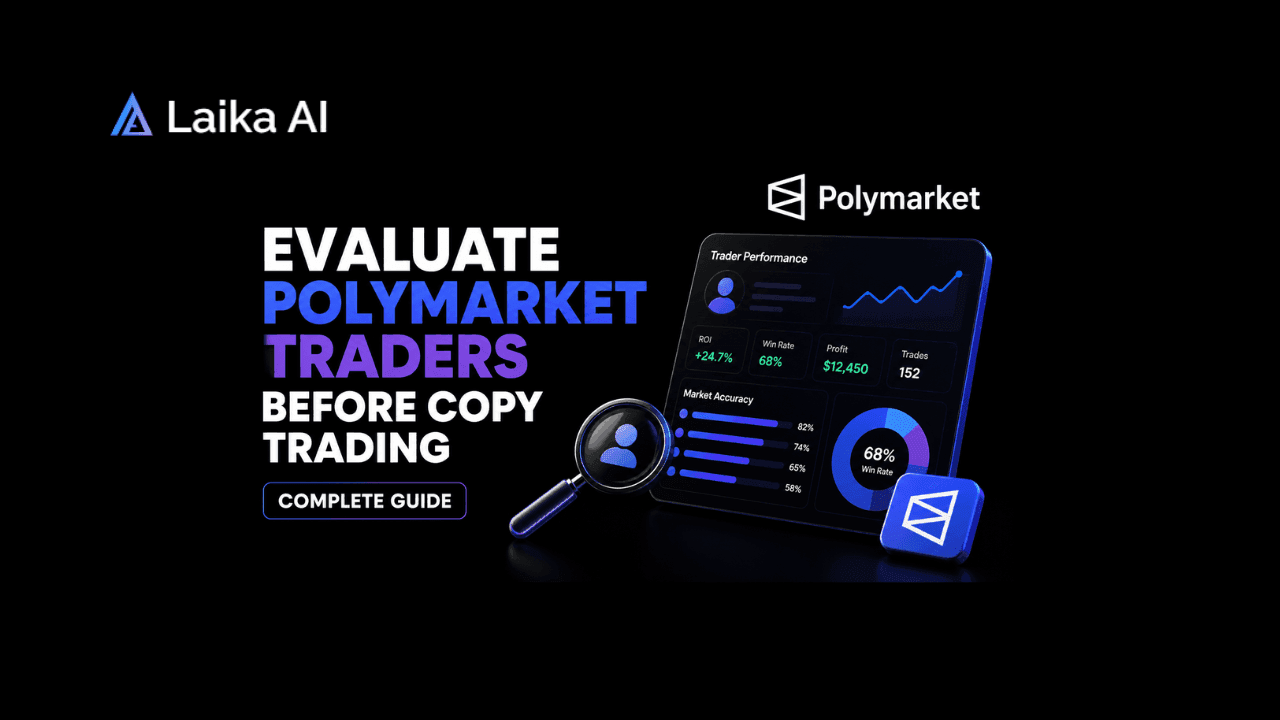
Most people look at one number profit. That is the wrong place to start.
A trader who made $40,000 last month might have made it on a single lucky position with terrible underlying logic. A trader who returned 18% across 200 trades with a 64% win rate is a completely different proposition. The difference between those two profiles is everything when you are deciding whether to copy someone's positions.
Polymarket's leaderboard surfaces names. It does not surface judgment. That gap is your job to close.
Why Profit Alone Is Meaningless
Raw profit figures on prediction markets are almost always misleading without context. A single high-confidence position on a near-certain outcome can generate large nominal returns while revealing nothing about a trader's analytical ability. Conversely, a trader grinding out consistent small edges across hundreds of markets might show modest headline numbers while demonstrating genuine skill.
The question you are trying to answer is not whether this person made money. It is whether this person made money because they are good, or because they got lucky in a way that will not repeat.
Luck and skill look identical in small samples. The entire work of track record evaluation is separating them.
Most Polymarket traders rely on headlines, emotions, and market momentum. That’s why they lose.
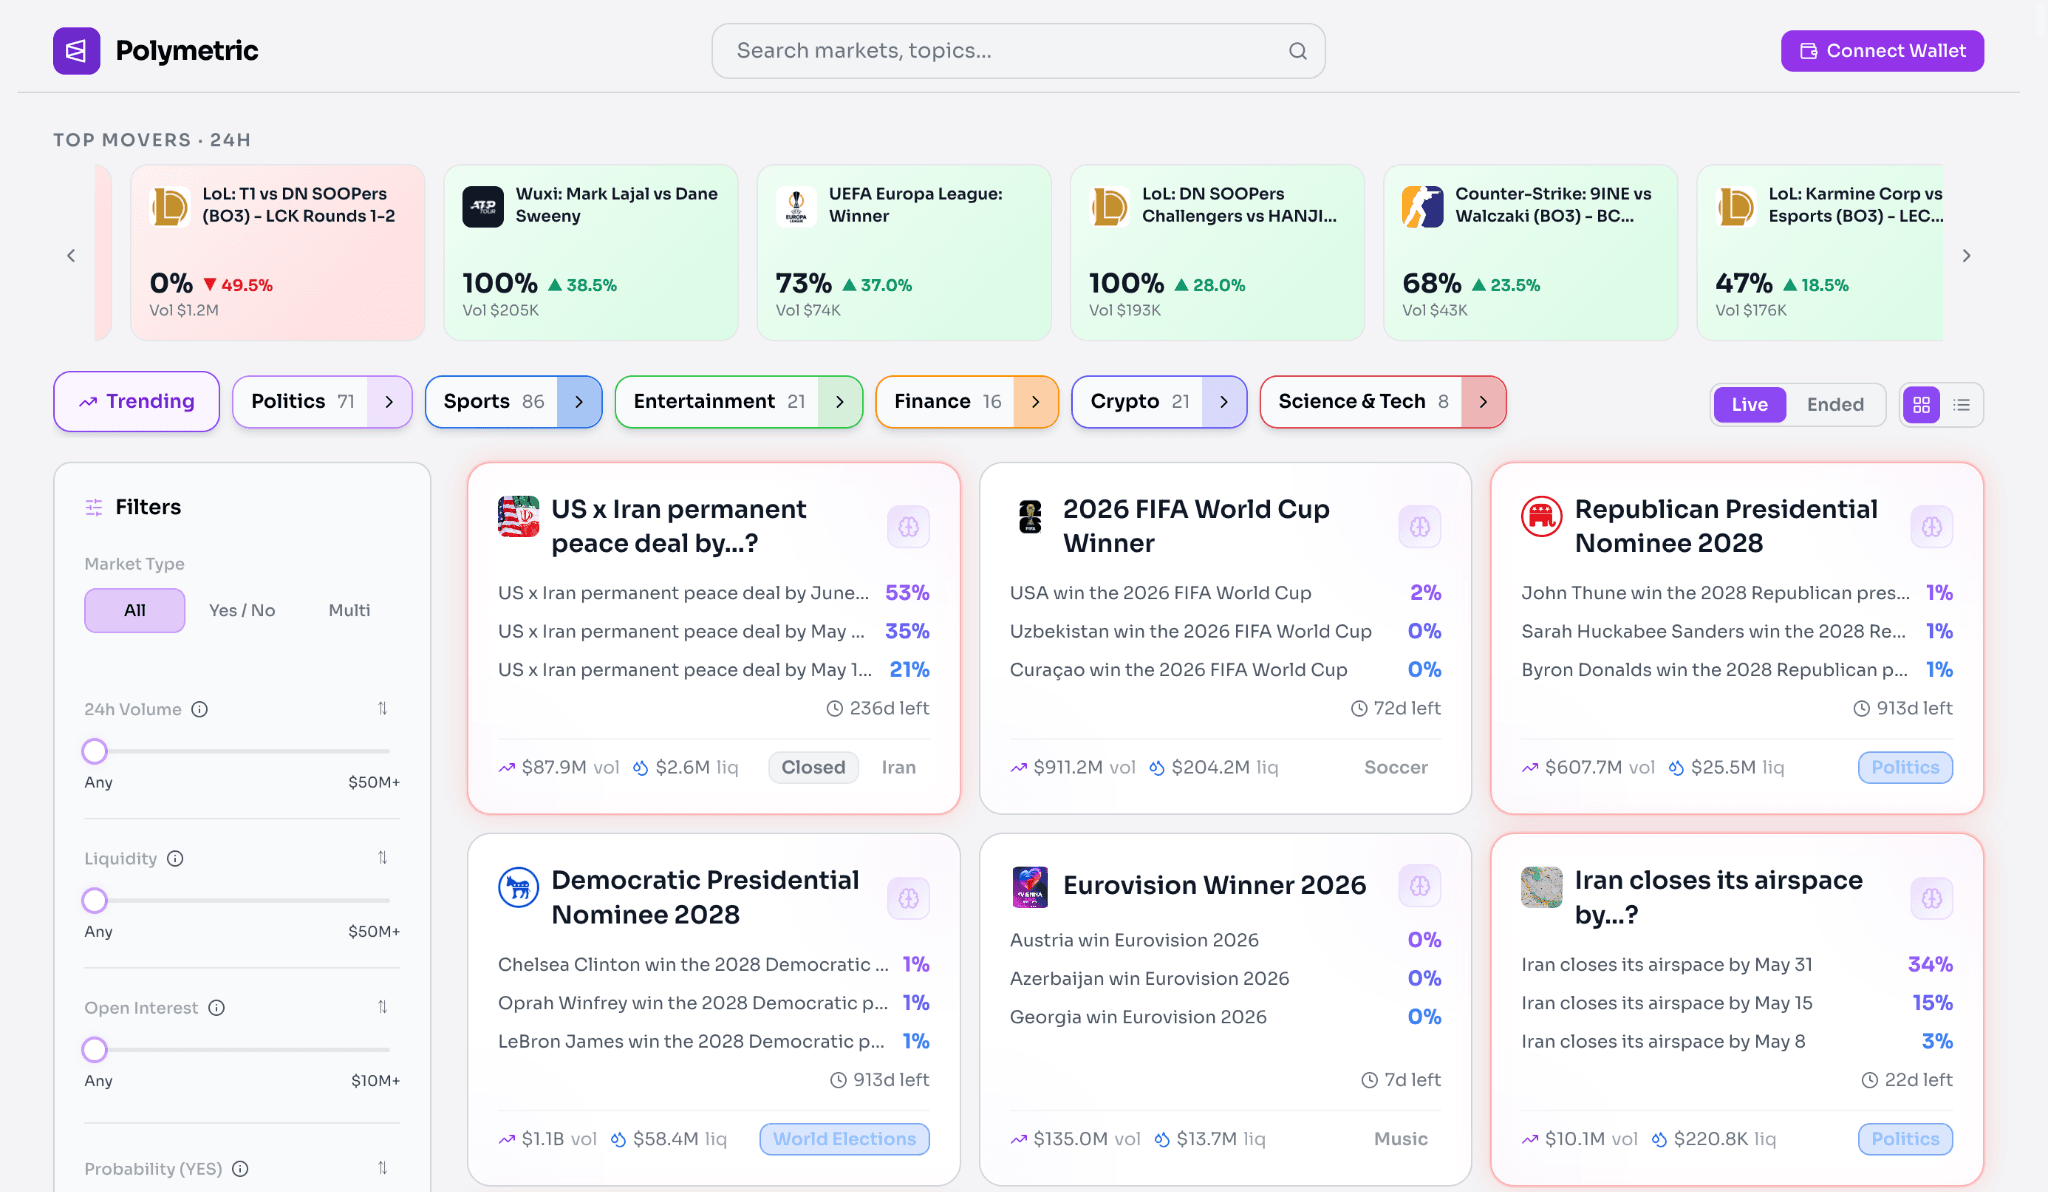
Polymetric by Laika AI gives you a real trading edge with AI-powered market analysis, whale wallet tracking, probability breakdowns, sentiment monitoring, and live market intelligence across politics, crypto, sports, and macro events.
If you're trading Polymarket without data, you're trading blind.
The Metrics That Actually Matter
Volume of Resolved Markets
Start here before looking at anything else. A track record built on fewer than 50 resolved markets tells you almost nothing statistically. Variance in prediction markets is high enough that a 30-trade sample can make a poor trader look excellent and a skilled trader look mediocre.
Look for traders with 100 or more resolved positions before taking their record seriously. The larger the sample, the more signal you are extracting from the noise.
Win Rate Adjusted for Market Type
A 70% win rate sounds impressive until you learn the trader exclusively bet on markets that were already trading above 85 cents. Buying near-certainties and collecting on them inflates win rate without demonstrating any real edge.
Evaluate win rate in the context of the average implied probability of the positions taken. A trader who wins 58% of markets where they were buying at 45 cents is demonstrating genuine calibration. A trader who wins 80% of markets where they were buying at 75 cents is mostly just riding well-priced consensus.
Calibration Across Probability Bands
The best way to assess a trader's skill is to look at whether their win rates match their implied confidence levels. If a trader consistently buys at 30 cents, they should be winning roughly 30% of those specific trades over a large enough sample. If they win 55% of those trades, they are finding a real edge in low-probability markets. If they win 15%, they are systematically overconfident at the bottom of the range.
This analysis requires pulling trade-level data rather than summary statistics. It is more work, but it is the most reliable signal available.
Return on Investment Per Trade, Not Total
Total returns are heavily influenced by position sizing. A trader who puts $50,000 into a single trade and wins looks very different from a trader generating the same dollar return across 200 smaller positions.
Calculate average ROI per resolved trade. This normalizes for position sizing and gives you a cleaner read on whether the trader is generating consistent edge or concentrating risk in ways that inflate their headline number.
Drawdown History
Every trader has losing streaks. What separates disciplined traders from undisciplined ones is how deep those streaks get and how long recovery takes.
Look at the worst consecutive losing run in the track record you are evaluating. A trader who went 0 for 18 at some point and recovered tells a different story than one whose losses are distributed evenly across the sample. Deep drawdowns often indicate either a specific category blind spot or a behavioral pattern like doubling down on losing theses.
Market Category Analysis
Does the Edge Concentrate in One Area?
Many profitable Polymarket traders are not generalists. They have genuine informational or analytical advantages in specific domains, such as political polling interpretation, sports statistics, economic data releases, or crypto on-chain metrics, and their edge is largely confined to those categories.
Before copying a trader, identify where their profits actually come from. If 80% of their returns trace back to sports markets and you are copying their political positions, you are not copying their edge. You are copying their guesses.
Pull their resolved trades by category and calculate win rate and ROI separately for each. The concentration of performance tells you as much as the overall number.
Recency of the Track Record
Markets evolve. A trader who dominated political prediction markets during one election cycle may have developed an edge specific to that moment's information environment. The same edge may not transfer to different regulatory conditions, different market liquidity, or different participant composition.
Weight recent performance more heavily than historical performance. A strong record from two years ago that has degraded over the last six months is a warning sign, not a reason for confidence.
Behavioral Signals to Watch For
Position Sizing Consistency
Disciplined traders size positions with some relationship to their assessed edge. Erratic sizing, huge positions on some trades and tiny ones on others without clear logic, often indicates emotional decision-making rather than systematic analysis.
Review the distribution of position sizes across a trader's history. Wild variance in sizing is a yellow flag even when the overall record looks positive.
How They Handle Losing Streaks
Some traders respond to losing streaks by reducing position sizes and reassessing. Others respond by increasing size to recover losses faster. The second pattern is a sign of loss-aversion-driven decision making and tends to produce spectacular blow-ups after long periods of apparent success.
If you can observe a trader's behavior during their documented losing periods, you will learn far more about their actual process than their winning periods will ever show you.
Speed of Entry After News
Traders who consistently enter positions immediately after breaking news events are likely paying for information that is already priced in. The smartest positioning on Polymarket tends to happen either well before events or in the less liquid period after initial overreaction, not in the first minutes of a news cycle.
If a trader's entry timestamps cluster around major news events, treat that as a signal that their edge may be more about activity than analysis.
Using Laika AI Tools to Accelerate Track Record Analysis
Manual track record analysis across hundreds of resolved positions is time-intensive. AI analysis tools can accelerate the process significantly by helping you structure the data, identify statistical patterns, and flag anomalies that would take hours to surface manually.
A practical workflow involves exporting available trade history data, running it through a structured prompt that asks for win rate by market category, average ROI per trade, drawdown depth, and position sizing distribution. The output gives you a framework to evaluate the trader against before you look at their current open positions.
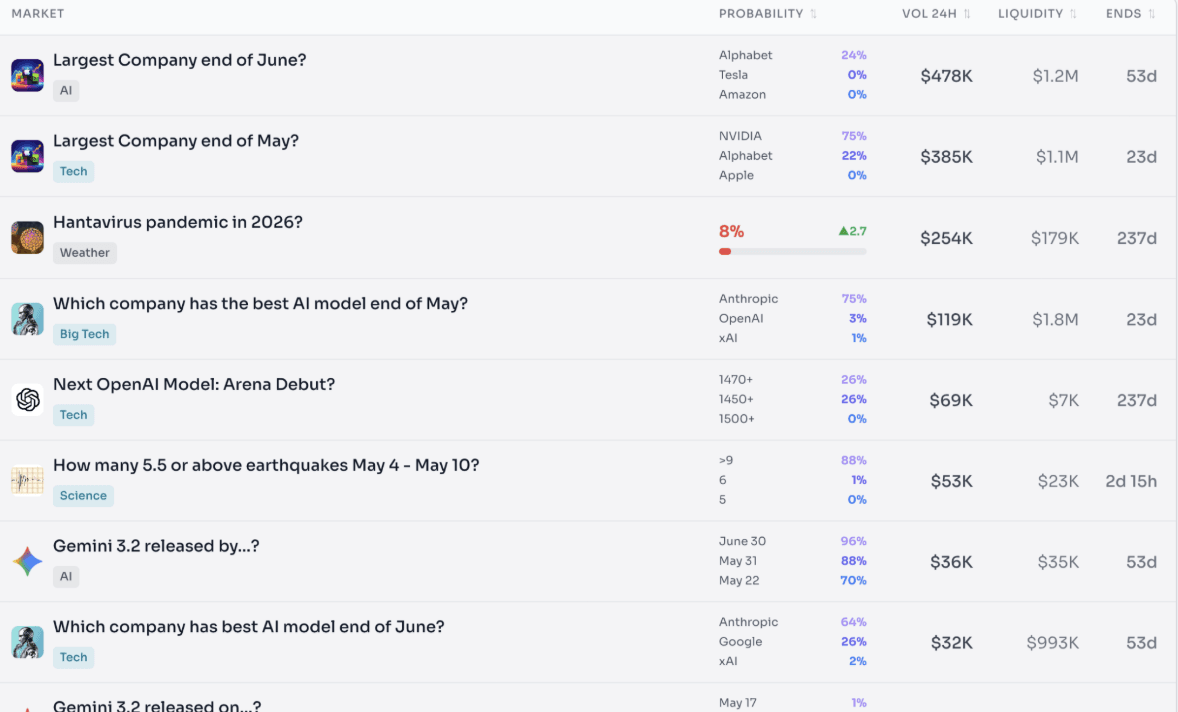
Laika AI's Polymarket tool surfaces on-chain position data and smart money signals that complement this kind of fundamental track record analysis, giving you a more complete picture of whether a trader's current positioning reflects genuine conviction or noise.
The Copy Trading Trap
Even a genuinely skilled trader is a poor copy target if you do not understand their reasoning. Position sizing decisions, entry timing, and exit strategy all depend on context that a raw trade feed does not provide.
If you copy a trader's YES position on a political market without knowing whether they entered at 35 cents or 65 cents, you are getting a fundamentally different trade at a fundamentally different price. The same direction can be a great bet or a terrible one depending entirely on where you get in.
Copy trading works best as a starting point for research, not as a substitute for it. Use a skilled trader's positions as a signal to investigate, not as an instruction to execute.
Frequently Asked Questions
How many trades does a Polymarket trader need before their record is meaningful?
At minimum 50 resolved trades before drawing any conclusions, and ideally 100 or more. Prediction markets have high enough variance that small samples are dominated by luck rather than skill. A 20-trade winning streak tells you almost nothing about a trader's actual ability.
What is the most important metric for evaluating a Polymarket trader?
Calibration across probability bands is the most reliable signal of genuine skill. If a trader's win rates consistently match the implied probabilities of their entry prices across a large sample, they are demonstrating real analytical edge rather than luck or selective risk-taking.
How do I tell if a trader's edge is in one category or general?
Break their resolved trades down by market category and calculate win rate and ROI separately for each. If performance concentrates heavily in one or two categories and the rest of the record is mediocre, their edge is domain-specific. Copying their positions outside that domain means copying their weakest thinking.
What behavioral patterns should disqualify a trader from being copied?
Erratic position sizing with no clear logic, a pattern of increasing bet size after losses, and a history of entering positions immediately after major news events are all serious warning signs. Each suggests emotional or reactive decision-making rather than disciplined analysis.
Can AI help with evaluating a trader's track record?
Yes, meaningfully. AI tools like laikaAI process large volumes of trade data quickly, identify statistical patterns across hundreds of resolved positions, and flag anomalies that would take hours to surface manually. They are most useful for structuring the analysis rather than replacing the judgment call at the end of it.