Successful crypto investing requires analyzing on-chain metrics, wallet concentration, exchange flows, development activity, and token supply dynamics. Not following hype. This guide reveals the data-driven framework professionals use to identify winners before markets price them in.
Why 95% of Crypto Investors Pick Assets Wrong
Here is the uncomfortable truth about cryptocurrency investing for beginners: most people are doing it backward.
They watch a token pump 300 percent and think they should have bought it. They read Twitter threads promising the next 100x. They follow influencers whose portfolios they have never verified. They buy whatever is trending on crypto news sites. Then they are shocked when 80 percent of their positions are down 60 percent six months later.
This is not investing. It is financial hope disguised as strategy.
The cryptocurrency investing guide you actually need does not start with which coins to buy. It starts with understanding what separates projects that survive from the 95 percent that slowly bleed to zero.
Between 2021 and 2024, over 8,000 cryptocurrencies launched with legitimate-looking whitepapers, professional websites, and ambitious roadmaps. By early 2026, fewer than 100 of those projects still maintain meaningful trading volume. The rest are effectively worthless.
The difference between the survivors and the failed projects is not luck. It is measurable through on-chain fundamentals that sophisticated investors track carefully. Most beginners do not even know these metrics exist.
This crypto investing 101 framework teaches you to analyze projects the way institutional allocators do: through verifiable blockchain data, wallet behavior analysis, development tracking, and liquidity assessment. Not hype. Not promises. Data.
Institutional capital increasingly shapes long-term crypto outcomes. To understand how large asset managers approach allocation, review our breakdown of BlackRock’s crypto holdings.
The Five-Layer Framework for Crypto Investment Analysis
Layer 1: On-Chain Activity. Does Anyone Actually Use This?
The blockchain does not lie. Every transaction, every wallet interaction, and every smart contract execution is permanently recorded and publicly auditable. This is the single biggest advantage crypto has over traditional investing. You can verify actual usage yourself.
Key Metrics to Analyze
Daily Active AddressesHow many unique wallets interact with the network daily?
Ethereum consistently shows over 400,000 daily active addresses. Solana exceeds 3 million. If a Layer 1 blockchain claiming to be the next Ethereum has 2,000 daily active addresses, that is not product-market fit. It is statistical irrelevance.
Transaction VolumeNot dollar volume, which can be manipulated through wash trading, but raw transaction count.
Solana processes over 35 million transactions daily. Bitcoin processes 400,000 to 600,000. A blockchain processing 10,000 transactions daily is not gaining traction. It is stagnating.
Transaction Fees PaidThis reveals willingness to pay.
Ethereum users paid over $2.1 billion in fees in 2025 because the network offers value worth paying for. If a blockchain’s total annual fees are $100,000, users are not finding sufficient utility.
Smart Contract InteractionsFor platforms like Ethereum and Solana, track daily smart contract calls. Are DeFi protocols, NFT marketplaces, and applications being used?
You can verify this through block explorers such as Etherscan or Solscan.
Where to Find This Data
• Blockchain explorers• Artemis Analytics• Token Terminal
Projects with declining on-chain activity despite rising token prices are major red flags. Price appreciation without usage growth signals speculation, not fundamental value creation.
Layer 2: Wallet Concentration. Who Actually Owns This Token?
Token distribution tells you more about investment risk than almost any other metric.
A cryptocurrency where the top 10 wallets control 80 percent of supply is a structural risk. When whales decide to exit, retail investors cannot absorb the selling pressure.
Metrics That Matter
Top 10, Top 50, Top 100 Holder ConcentrationHealthy projects typically show top 10 holders controlling less than 30 to 40 percent of circulating supply, excluding exchange wallets and provably locked allocations.
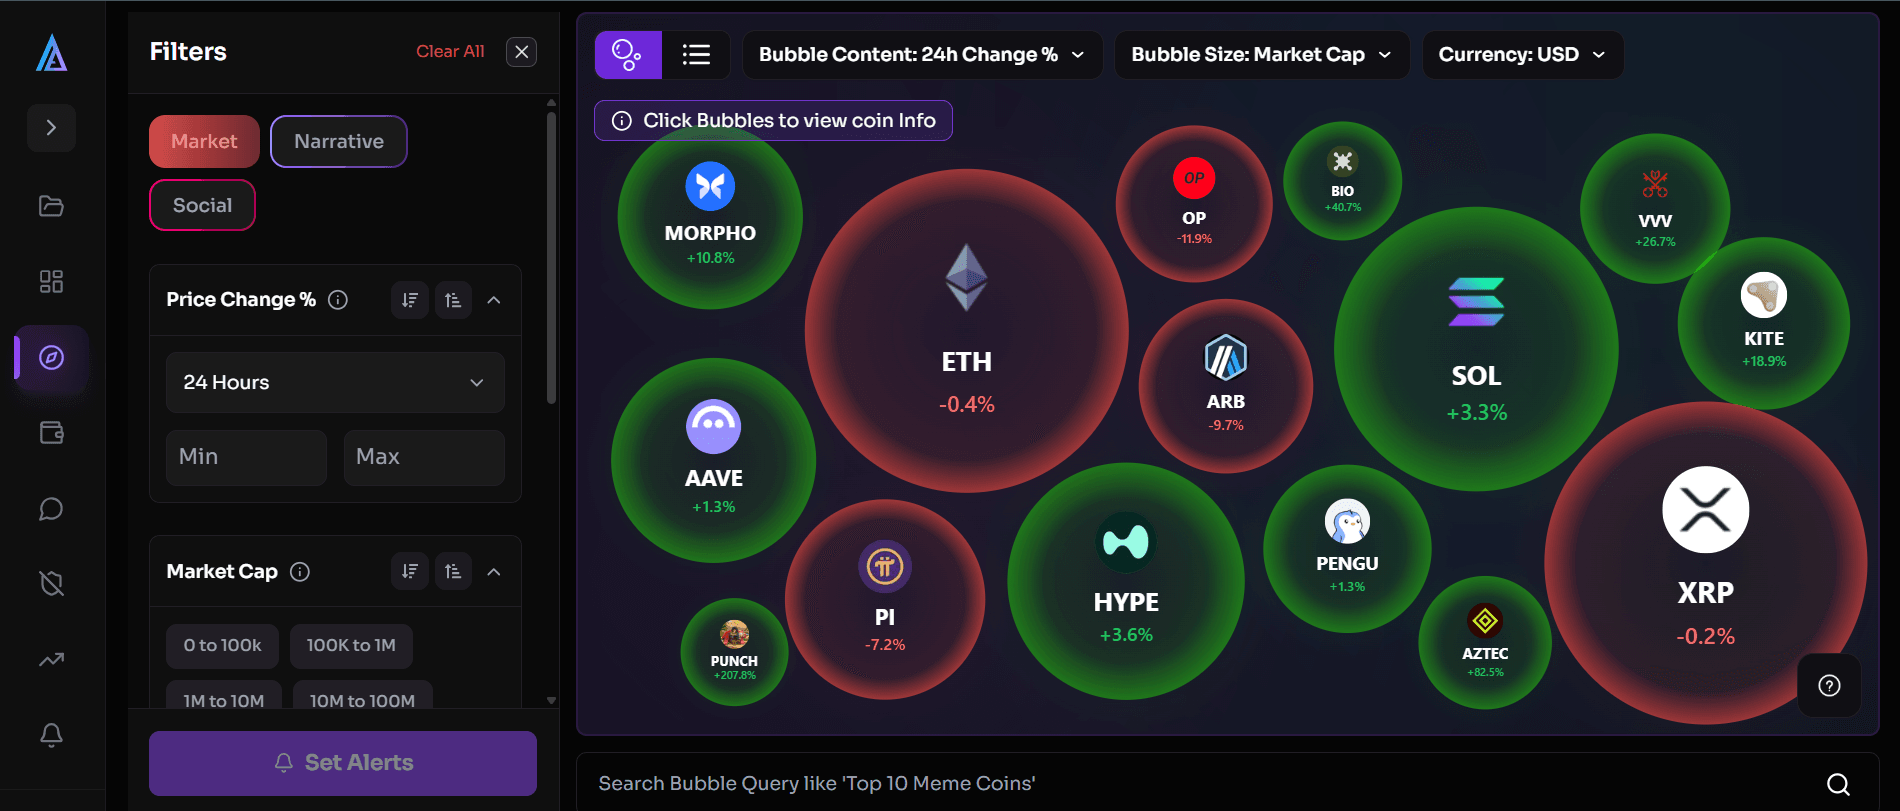
Gini CoefficientA statistical measure of wealth inequality.0 equals perfectly equal distribution.1 equals one wallet owning everything.
Bitcoin’s Gini coefficient is approximately 0.87, highly concentrated but historically stable. New tokens with Gini coefficients above 0.95 indicate extreme centralization risk.
Whale Accumulation vs Distribution PatternsAre large holders accumulating or distributing? This is forward-looking intelligence.
Track Crypto Whale Wallets With Laika Before They Move Markets
This is where Laika Labs Wallet Tracker becomes critical.
Laika monitors any crypto wallet in real time, alerting you when whales start accumulating or distributing positions. Professional traders do not wait for price to move. They watch on-chain flows before major moves happen.
Set alerts for:
• Top 50 holder balance changes• Large transfers to or from exchanges• Accumulation patterns by historically profitable wallets
When a whale holding 5 percent of a token’s supply starts moving funds to Binance, that is not random. It is advance warning before the market reacts.
Example use case: A trader monitoring a mid-cap altcoin notices three wallets in the top 20 holders simultaneously transferring tokens to centralized exchanges over 48 hours. This is a distribution signal. Price has not moved yet, but selling pressure is building. Laika alerts allow you to exit before broader participants realize what is happening.
Layer 3: Exchange Dynamics. Liquidity and Capital Flows
A token can have strong on-chain metrics and balanced distribution, but if it lacks liquidity, you are financially trapped.
Liquidity determines whether you can exit positions at reasonable prices when needed.
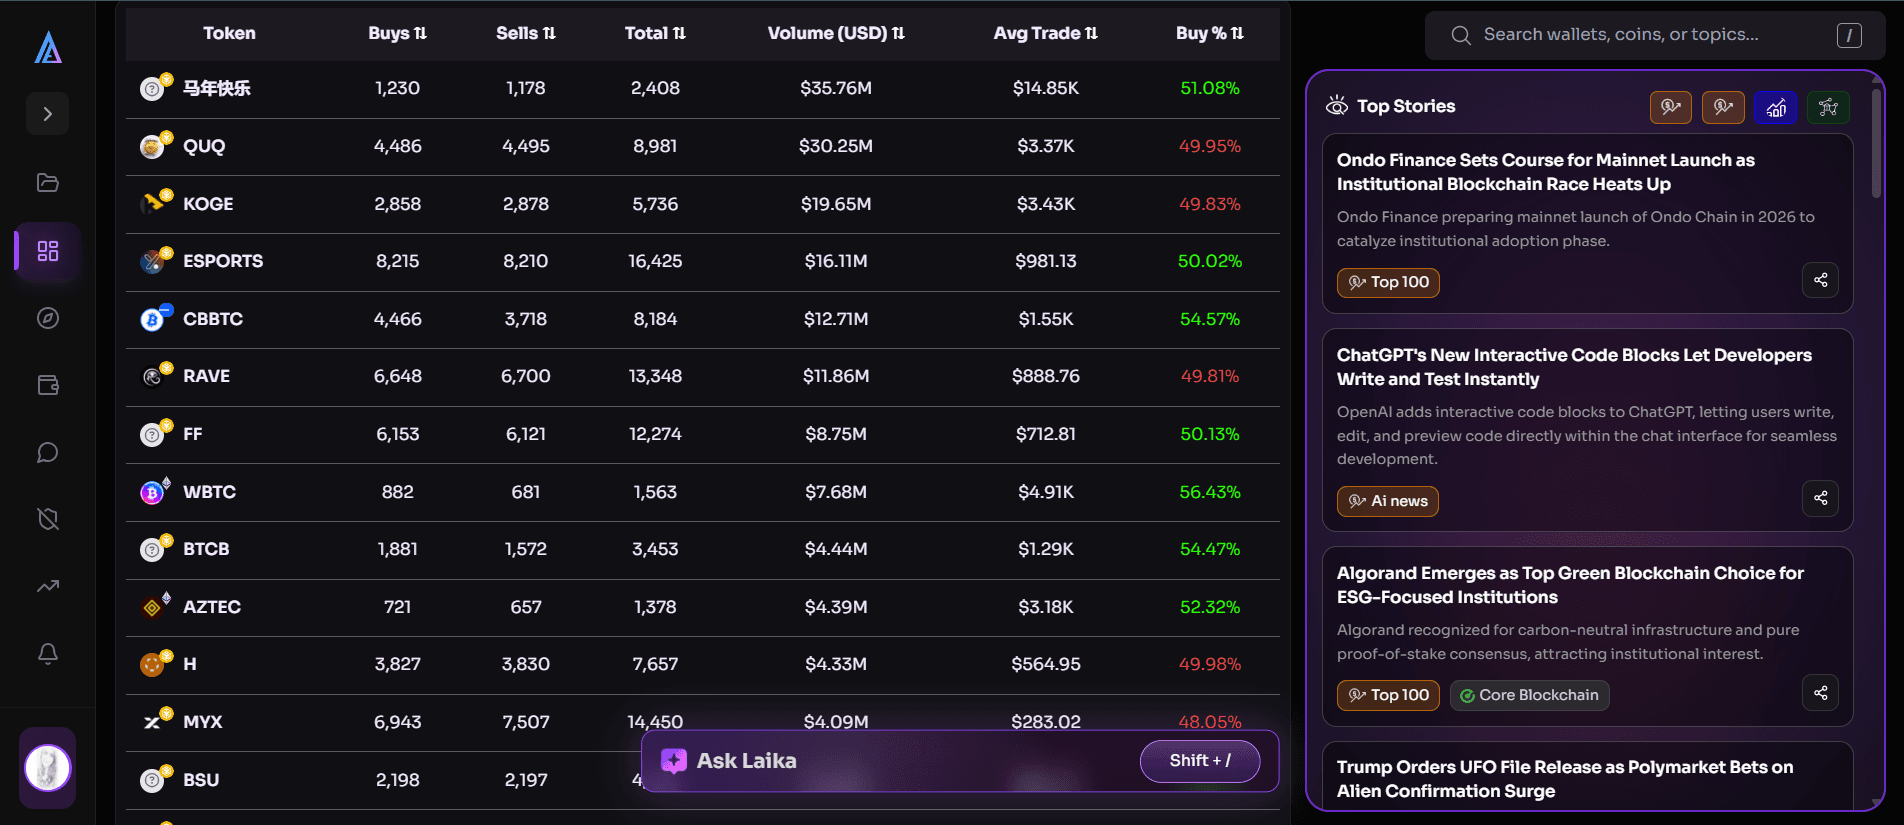
Order Book Depth
On major exchanges such as Binance, Coinbase, or Kraken, examine how much capital sits within 2 percent of the current price on both sides.
Practical test: Could you sell $100,000 worth without moving price more than 3 percent? If not, liquidity is insufficient for serious sizing.
Slippage on Large Orders
Use aggregators such as Jupiter or 1inch to simulate trades. If a $50,000 order results in 8 percent slippage, that is not minor friction. It is structural illiquidity.
Exchange Listings
Tier 1: Binance, Coinbase, KrakenTier 2: KuCoin, OKXTier 3: Small decentralized exchanges only
Tier 3 listings carry significantly higher manipulation risk.
Capital Flows
Are funds moving into exchanges or off exchanges?
Sustained negative netflows often signal accumulation. Positive netflows signal preparation for selling.
The screenshot on page 4 of your document shows real-time wallet-to-exchange outflows tracked via Laika.
Stablecoins also influence liquidity conditions. For infrastructure context, see our analysis of the Top 10 Stablecoins in 2026.
Layer 4: Development Activity. Is the Project Actually Building?
Crypto projects live or die based on development velocity.
GitHub Activity
Look for:
• Consistent weekly commits• Multiple active contributors• Transparent issue tracking• Community pull requests
Ethereum averages over 100 active core developers monthly. Solana supports thousands of active developers. A blockchain claiming to compete but showing five developers is not a competitor. It is marketing.
Tools for GitHub Analysis
• Electric Capital Developer Report• CryptoMiso• Direct repository inspection
Testnet activity and ecosystem grants also signal long-term commitment.
Layer 5: Tokenomics and Unlocks. The Supply Shock Most Investors Ignore
Token supply dynamics determine whether appreciation is structurally possible.
Circulating vs Total Supply
If only 20 percent of tokens are circulating, where is the remaining 80 percent? When does it unlock?
Token Terminal and Messari track unlock schedules. Always verify before investing.
Inflation Rate
Bitcoin: Fixed supplyEthereum: Often deflationary during high activitySolana: Approximately 5 percent annual inflation
Utility and Demand Sinks
Does the token have structural demand?
• Transaction fees• Staking• Governance• Revenue sharing
Red flag: Tokens with no utility beyond price appreciation and heavy upcoming unlocks create structural downward pressure.
Crypto Investing Strategies: Building a Real Portfolio
The 60 / 25 / 15 Allocation Framework
60 percent: Bitcoin and EthereumYour foundation. Review our analysis of Bitcoin as digital gold to understand why it functions as crypto’s reserve asset.
25 percent: Emerging EcosystemsProjects such as Solana or Avalanche that demonstrate real traction.
Understanding macro rotation is critical. Our breakdown of Altcoin Season 2026 explains when capital historically rotates from Bitcoin into higher-risk assets.
15 percent: Conviction BetsDeep research positions. Highest risk. Highest potential.
Dollar-Cost Averaging vs Lump Sum
For most investors, dollar-cost averaging reduces timing risk.
Example: Invest $1,000 per month over 12 months instead of $12,000 at once.
What Laika AI Offers That Most Tools Do Not
Most analytics platforms provide historical dashboards. Laika provides forward-looking intelligence.
Real-time whale monitoring and exchange flow alerts give insight before price moves become visible.
Institutional desks pay significant sums for this category of intelligence. Laika makes similar data accessible in real time.
Start tracking crypto whale wallets with Laika AI.
Frequently Asked Questions
Is crypto a good long-term investment?
Bitcoin and Ethereum have demonstrated long-term viability. However, 95 percent of altcoins fail to recover after severe drawdowns. Success depends on disciplined selection and allocation.
Why should you invest in cryptocurrencies?
Primary reasons include asymmetric return potential, diversification benefits, and inflation hedge characteristics. However, only allocate capital you can afford to lose.
Which crypto is best to invest in?
Bitcoin and Ethereum remain safest for beginners. Diversification into established altcoins depends on research depth and risk tolerance.
Is investing in crypto safe?
Crypto remains volatile and high risk. Diversification, secure custody, and position sizing are critical risk controls.