
Liquidity separates markets where traders profit from skill and analysis from markets where execution costs destroy edge regardless of prediction accuracy. Understanding order book depth, measuring slippage impact, identifying liquid versus illiquid markets, timing entries during peak liquidity windows, and avoiding liquidity traps represents essential knowledge for sustainable Polymarket profitability. This comprehensive guide explains what liquidity means in prediction markets, details how to measure order book depth and bid-ask spreads, provides frameworks for minimum liquidity thresholds by position size, compares liquidity across market categories identifying consistently tradeable contracts, reveals timing patterns when liquidity peaks and crashes, and demonstrates how professional traders using Laika AI’s Polymetric systematically avoid thin markets through automated liquidity monitoring and intelligent market selection.
Understanding Liquidity in Prediction Markets
Liquidity measures the market's ability to absorb buy and sell orders without significant price movement enabling traders entering and exiting positions near displayed prices.
Order Book Depth Definition
Order Book: Complete list of all pending buy (bid) and sell (ask) orders at different price levels for specific markets.
Depth Analysis: This market shows
- Best bid: 61 cents with $8,700 available
- Best ask: 62 cents with $3,400 available
- Spread: 1 cent (62 - 61)
- Total bid depth (59-61 cents): $46,500
- Total ask depth (62-64 cents): $20,500
Why Liquidity Matters
Impact on Execution: Trader wanting to buy $10,000 YES position faces two scenarios:
Liquid Market ($100,000+ depth):
- Current ask: 62 cents
- Order book: $25,000 at 62 cents, $40,000 at 62.5 cents, $50,000 at 63 cents
- Execution: Buy $10,000 at 62 cents exactly
- Slippage: $0 (executed at displayed price)
Illiquid Market ($10,000 depth):
- Current ask: 62 cents
- Order book: $3,400 at 62 cents, $2,800 at 64 cents, $4,200 at 67 cents
- Execution: Buy $3,400 at 62 cents, $2,800 at 64 cents, $3,800 at 67 cents
- Weighted average: 64.7 cents versus displayed 62 cents
- Slippage: 2.7 cents = 4.4% immediate loss
Real Cost: On an illiquid market, a trader pays $6,470 for a position showing $6,200 value (buying at 62 cents) creating an instant $270 loss (4.4%) before market moves. Combined with 2% Polymarket fee, total cost reaches 6.4% requiring market movement of 6.4+ cents just to break even.
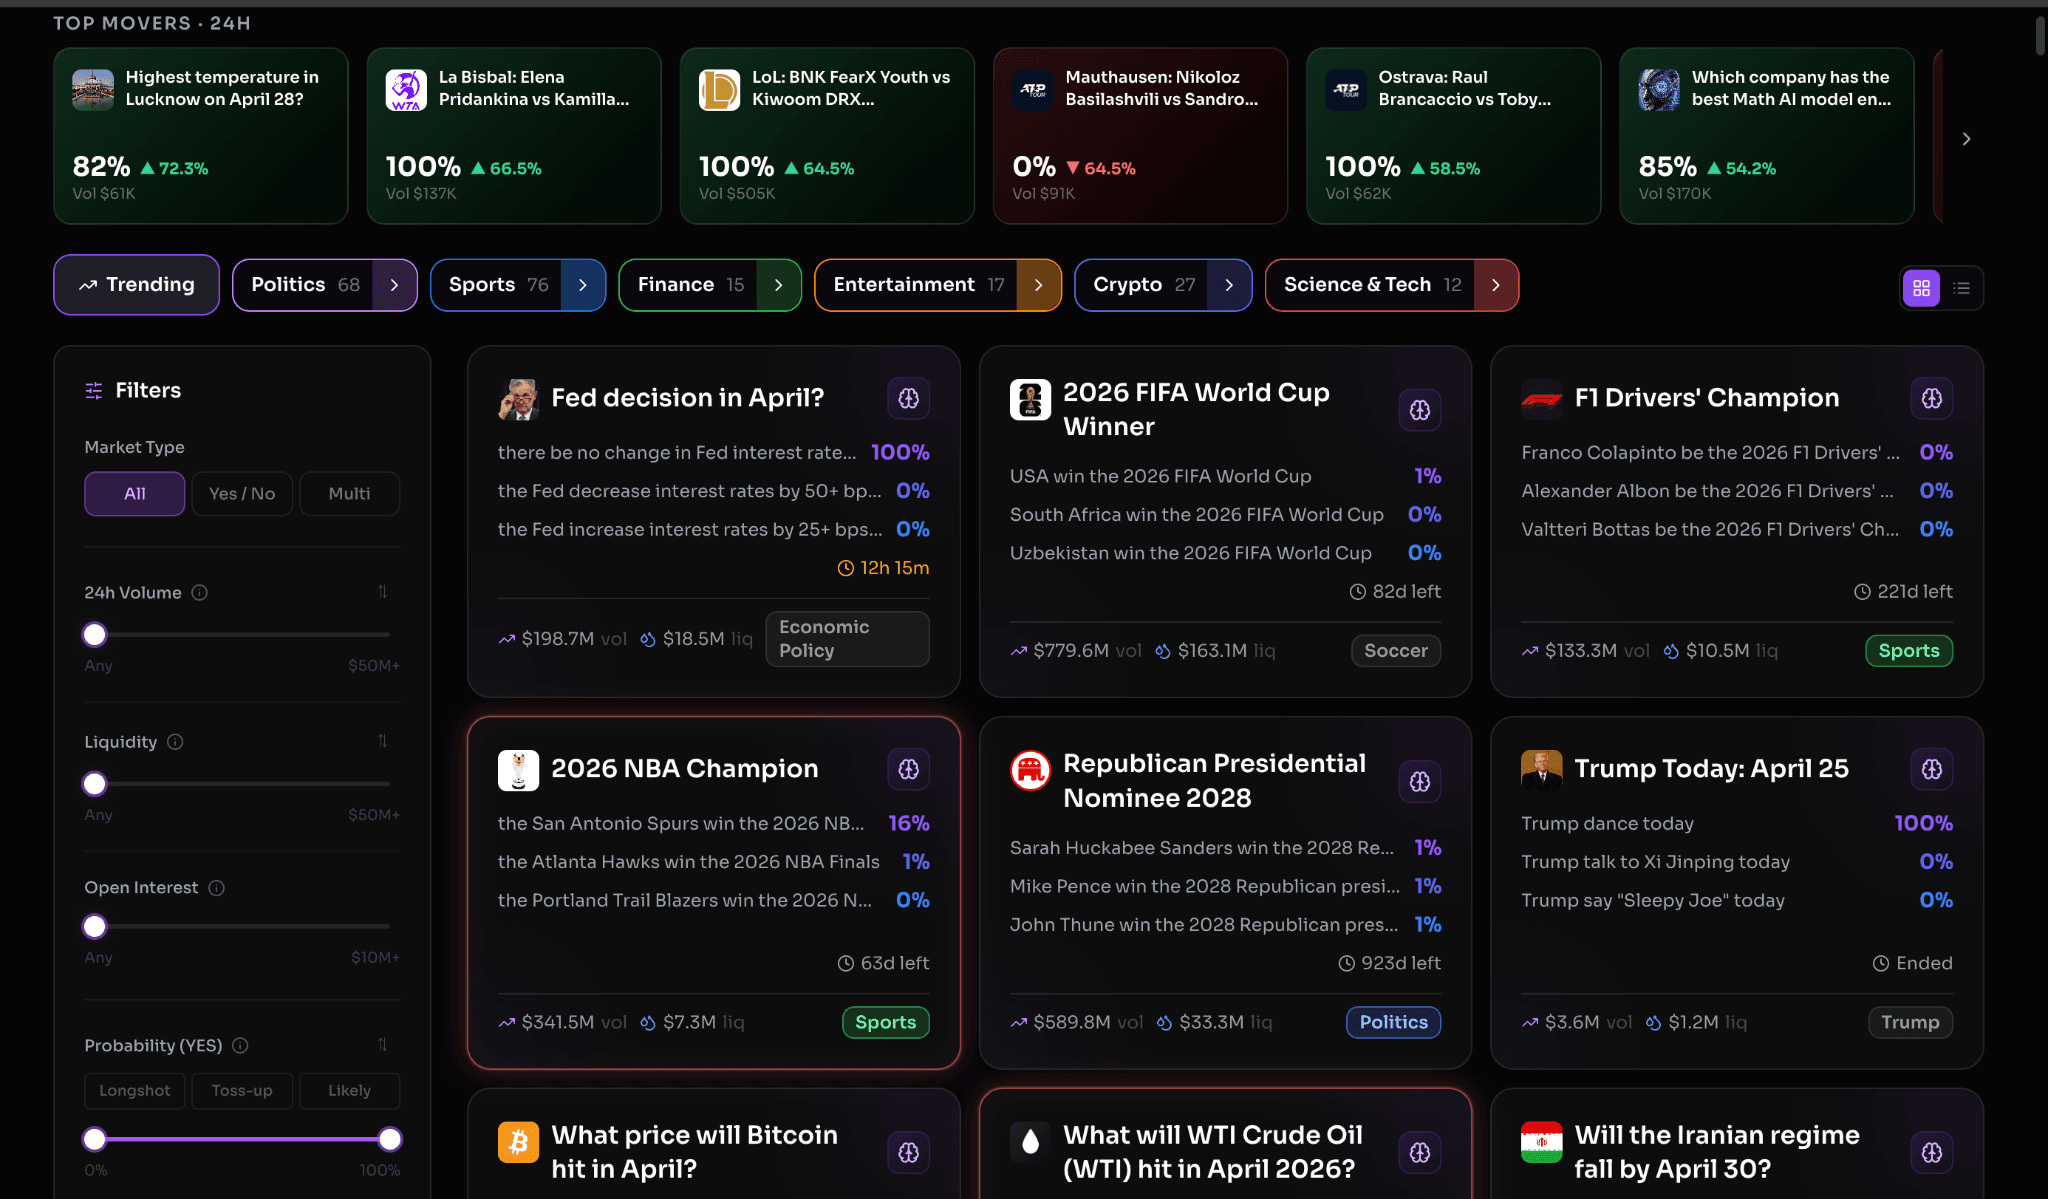
Top movers tell you where the action is, not the headlines Most people guess. Smart ones follow the money. On Polymarket, millions are being placed on outcomes every day but the real edge is knowing who is betting big and why.
Our platform shows you top traders, their positions, and where serious capital is moving. No noise, just signal.
Liquidity vs Volume Distinction
Liquidity: Current depth of order book (how much can trade NOW without slippage)
Volume: Historical trading activity (how much TRADED in past 24 hours/week)
Critical Difference: High-volume markets may show poor current liquidity if all volume occurred as large trades that cleared the order book. Conversely, low-volume markets might maintain excellent depth if market makers constantly refresh orders.
Example:
- Market A: $500,000 volume last 24 hours, current depth $8,000 (thin despite high volume)
- Market B: $50,000 volume last 24 hours, current depth $80,000 (liquid despite lower volume)
Trader Impact: Market B provides better execution quality than Market A despite lower volume. Focus on current depth not historical volume when assessing tradability.
Measuring Order Book Depth and Spreads
Systematic liquidity analysis requires quantitative assessment of order book characteristics.
Bid-Ask Spread Analysis
Spread Definition: Difference between best bid (highest buy order) and best ask (lowest sell order).
Spread Calculation
- Best bid: 61 cents
- Best ask: 62 cents
- Absolute spread: 1 cent
- Percentage spread: (62 - 61) / 61.5 × 100 = 1.63%
Spread Interpretation
- 0-1 cent (0-1.5%): Excellent liquidity, professional market making
- 1-2 cents (1.5-3%): Good liquidity, acceptable for most trading
- 2-4 cents (3-6%): Moderate liquidity, careful position sizing needed
- 4+ cents (6%+): Poor liquidity, avoid or use limit orders only
Spread Impact: Wide spreads create immediate loss when round-tripping (buying then selling).
Example
- Buy at ask: 64 cents
- Sell at bid: 60 cents
- Loss: 4 cents = 6.25% on 64 cent entry
- Combined with 2% fee: 8.25% total cost for round-trip
Depth Within Price Ranges
2-Cent Depth: Industry standard measures total liquidity within 2 cents of mid-price.
Calculation
- Mid-price: (61 + 62) / 2 = 61.5 cents
- Range: 59.5 to 63.5 cents (±2 cents from mid)
- Bid depth in range: $46,500 (59-61 cents)
- Ask depth in range: $36,400 (62-64 cents)
- Total 2-cent depth: $82,900
Threshold Recommendations
- $1,000 position: Minimum $5,000 depth (5x position size)
- $5,000 position: Minimum $25,000 depth (5x position size)
- $10,000 position: Minimum $50,000 depth (5x position size)
- $50,000 position: Minimum $250,000 depth (5x position size)
5x Rule: Order book should contain at least 5x your position size within 2 cents of mid-price preventing excessive slippage. Violating this rule creates 3-8% slippage on average.
Professional traders using Laika AI’s Polymetric access advanced liquidity analytics impossible through basic Polymarket interface
Identifying Liquid vs Illiquid Markets
Different market categories show predictable liquidity patterns enabling systematic liquid market selection.
Highly Liquid Market Categories
Presidential Elections
- Depth: $2-8 million during campaign season
- Spread: 0.5-1 cent typical
- Position capacity: $50,000-$200,000 without material slippage
- Examples: "Will Democrat win 2024", "Trump vs Biden head-to-head"
Major Sports Championships
- Depth: $500,000-$2 million during playoffs
- Spread: 1-2 cents typical
- Position capacity: $20,000-$80,000
- Examples: Super Bowl winner, NBA Finals, World Series
Bitcoin Price Predictions
- Depth: $300,000-$1.5 million on major thresholds
- Spread: 1-2 cents typical
- Position capacity: $10,000-$50,000
- Examples: "Will BTC exceed $100K by December", "BTC above $150K by 2027"
Fed Rate Decisions:
- Depth: $200,000-$800,000 before FOMC meetings
- Spread: 1-2 cents typical
- Position capacity: $10,000-$40,000
- Examples: "Will Fed cut rates in June", "3+ rate cuts by year end"
Moderately Liquid Markets
Competitive Senate Races
- Depth: $50,000-$200,000 during election season
- Spread: 2-3 cents typical
- Position capacity: $5,000-$20,000
- Examples: Pennsylvania Senate, Arizona Senate, Georgia Senate
Major Weather Events
- Depth: $30,000-$100,000 for large cities
- Spread: 2-4 cents typical
- Position capacity: $3,000-$10,000
- Examples: "NYC temperature exceeds 90°F tomorrow", "Hurricane makes landfall Florida"
Ethereum Price Predictions
- Depth: $40,000-$150,000 on round numbers
- Spread: 2-4 cents typical
- Position capacity: $5,000-$15,000
- Examples: "ETH above $5K by June", "ETH flips BTC by 2027"
Illiquid Market Categories (AVOID)
Niche Political Races
- Depth: $3,000-$15,000
- Spread: 4-10 cents typical
- Position capacity: $500-$2,000 maximum
- Examples: State legislature races, local elections, obscure primaries
Entertainment Predictions
- Depth: $5,000-$25,000
- Spread: 3-8 cents typical
- Position capacity: $1,000-$3,000
- Examples: Oscar winners, Grammy predictions, box office results
Quick Liquidity Assessment Framework
Before analyzing any market fundamentals, check liquidity first:
Step 1: Navigate to market on Polymarket Step 2: Click the order book view showing bids and ask Step 3: Calculate 2-cent depth (sum orders within ±2 cents of mid-price) Step 4: Apply 5x rule: Is depth at least 5x your intended position?
Yes → Proceed with fundamental analysis
No → Skip market regardless of analytical edge
Timing Entries During Peak Liquidity Windows
Liquidity fluctuates dramatically based on time of day, day of week, and proximity to resolution creating optimal and terrible entry windows.
Intraday Liquidity Patterns
Peak Hours (9am-9pm ET):
- US trading hours when most participants active
- Liquidity 3-5x higher than overnight periods
- Spreads tightest: 1-2 cents versus 3-6 cents overnight
- Recommendation: Execute large positions during peak hours
Off-Peak Hours (9pm-9am ET):
- Liquidity drops 60-80% as US traders sleep
- International traders partially fill gap but volume lower
- Spreads widen significantly
- Recommendation: Avoid trading or use limit orders only
Example Data (Presidential election market):
- 2:00 PM ET: $5.2 million depth, 0.8 cent spread
- 3:00 AM ET: $1.1 million depth, 2.4 cent spread
- Degradation: 79% depth loss, 200% spread increase
Practical Application:
- Need to buy $30,000 position
- Option A: Execute at 3am (off-peak) facing 3-5% slippage = $900-$1,500 cost
- Option B: Wait until 2pm (peak) facing 0.5-1% slippage = $150-$300 cost
- Savings: $600-$1,200 simply from timing entry during liquid hours
Pre-Resolution Liquidity Surge
48-Hour Window: Final 48 hours before market resolution concentrates 60-80% of total historical volume as outcome becomes certain attracting final positioning.
Liquidity Pattern:
- 7+ days before resolution: Baseline liquidity
- 3-6 days before: 20-40% increase as interest builds
- 24-48 hours before: 200-500% increase as outcome clarifies
- 6-12 hours before: 300-800% increase (peak liquidity)
- 0-6 hours before: 100-300% increase (late rush)
Trading Implications:
Early Entry Strategy:
- Enter positions 7-30 days before resolution
- Accept moderate liquidity (may face 2-4% slippage)
- Hold through resolution capturing full profit potential
- Risk: Liquidity may worsen trapping position if thesis invalidated
Late Entry Strategy:
- Wait until 24-48 hours before resolution
- Execute in peak liquidity window (0.5-1.5% slippage)
- Accept smaller profit opportunity as market pricing more accurate
- Benefit: Easy exit if thesis changes, superior execution quality
Example (Fed rate decision market):
- Entry 14 days before FOMC: $120,000 depth, 2.5% slippage on $10,000 position
- Entry 36 hours before FOMC: $980,000 depth, 0.6% slippage on $10,000 position
- Trade-off: Early entry at 52 cents with high slippage vs late entry at 58 cents with low slippage
Event-Driven Liquidity Spikes
Certain events create temporary 5-20x liquidity surges as traders react to new information:
Political Events:
- Debates: 10-15x surge during and 2 hours after
- Major polls: 5-8x surge within 30 minutes of release
- Breaking scandals: 8-12x surge in first hour
- Election night: 15-30x surge as results reported
Economic Events:
- Fed announcements: 12-20x surge at 2pm ET release
- Jobs reports: 8-12x surge at 8:30am ET release
- Inflation data: 8-12x surge at 8:30am ET release
Sports Events:
- Games in-progress: 20-40x surge during gameplay
- Injury news: 5-10x surge within 15 minutes
- Playoff elimination: 10-15x surge immediately after
Trading Strategy: Monitor event calendar positioning ahead of known liquidity spikes enabling large position entry/exit during temporary depth windows that disappear post-event.
Real Examples: Liquid vs Illiquid Market Disasters
Concrete case studies demonstrate liquidity impact on trading outcomes.
Case Study 1: Presidential Election Success (Liquid Market)
Market: "Will Democrat win 2024 Presidential Election"
Liquidity Profile:
- Average depth: $4.2 million
- Spread: 0.6-1 cent typical
- Peak depth: $8.7 million (election week)
Trade Execution
- Strategy: Buy YES at 45 cents in June 2024
- Position size: $50,000
- Order book: $180,000 available at 45 cents, $320,000 at 45.5 cents
- Execution: Complete fill at 45 cents (displayed price)
- Slippage: $0 (0%)
Position Management
- Hold through election season
- Exit at 62 cents on election night
- Order book: $240,000 available at 62 cents
- Exit execution: Complete fill at 62 cents
- Exit slippage: $0 (0%)
Results
- Entry: $50,000 at 45 cents = 111,111 shares
- Exit: 111,111 shares at 62 cents = $68,889
- Profit: $18,889
- Slippage cost: $0
- Fee cost: $18,889 × 2% = $378
- Net profit: $18,511 (37% ROI)
Key Takeaway: Excellent liquidity enabled clean $50,000 entry and exit at displayed prices preserving full analytical edge without execution losses.
Avoiding Liquidity Traps and Exit Problems
Illiquid markets create asymmetric risk where entry is possible but exit becomes impossible trapping capital.
The Liquidity Trap Mechanism
Entry Phase (Trap Opening)
- Market shows 30 cents YES with thin $8,000 order book
- Trader buys $5,000 position averaging 32 cents (2 cent slippage)
- Position represents 62.5% of total market depth (massive)
Movement Phase (Trap Closing)
- Market moves to 45 cents validating thesis (50% gain potential)
- Liquidity dried up: Now only $3,000 depth total
- Trader's $7,250 position (5,000 shares × $1.45 unrealized value) represents 240% of market depth
Exit Phase (Trap Sprung)
- Attempt to take profit selling at displayed 45 cents
- Order book: $800 at 45 cents, $900 at 42 cents, $700 at 38 cents, $600 at 35 cents
- Weighted average exit: 40.2 cents versus displayed 45 cents
- Exit slippage: 4.8 cents = 10.7%
- Net profit: (40.2 - 32) = 8.2 cents versus potential (45 - 32) = 13 cents
- Slippage destroyed: 37% of potential profit
Worst Case: Market reverses to 35 cents before exit possible. Forced to sell into an even thinner market averaging 28-30 cents creating net loss despite being correct in direction.
Warning Signs of Liquidity Traps
Red Flags Before Entry
- Your position size exceeds 20% of total order book depth
- Spread wider than 3 cents (5%+)
- Less than $25,000 total depth both sides combined
- Volume last 24 hours under $10,000
- User-created market with under 50 participants
- Market creator has under 5 total markets created (low credibility)
Any 3+ red flags present → Skip market regardless of analytical edge
Position Sizing for Illiquid Markets
If forced to trade illiquid market due to unique opportunity:
Conservative Approach
- Maximum position: 10% of order book depth
- Example: $15,000 market depth → max $1,500 position
- Reduces slippage to 1-2% versus 8-12% with larger sizing
Split Entry/Exit
- Enter position across multiple sessions 2-4 days apart
- Each tranche: 3-5% of depth
- Allows market makers to refresh liquidity between tranches
- Exit similarly: 3-4 separate sales 1-2 days apart
Limit Orders Only
- Never use market orders in thin markets
- Place limit orders at desired price willing to wait hours or days for fill
- Accepts missing opportunity versus guaranteed terrible execution
Frequently Asked Questions
How much liquidity is needed to trade Polymarket
Minimum $25,000 total order book depth within 2 cents of mid-price for $5,000 positions, $50,000 depth for $10,000 positions, and $250,000 depth for $50,000 positions following 5x rule (depth should exceed position size by 5x factor). Violating this creates 5-15% slippage destroying profitability before fees and market movement.
What is bid-ask spread on Polymarket
Bid-ask spread measures the difference between best buy price (bid) and best sell price (ask). Liquid markets show 0.5-2 cent spreads (1-3%), moderate markets show 2-4 cent spreads (3-6%), and illiquid markets show 4+ cent spreads (6%+). Wide spreads create immediate loss when entering and exiting positions effectively taxing traders 6-12% on round-trips.
Why do thin Polymarket markets have bad prices
Thin markets lack professional market makers maintaining tight spreads and deep order books. With only $5,000-$15,000 depth, single $10,000 order moves prices 5-15 cents creating massive slippage. Retail limit orders provide spotty liquidity with wide gaps between price levels forcing traders accepting terrible execution or waiting hours/days for fills.
When is best time to trade Polymarket for liquidity
Weekday trading hours 9am-9pm ET show 3-5x higher liquidity than overnight periods with tighter 1-2 cent spreads versus 3-6 cent overnight spreads. Final 24-48 hours before market resolution provide peak liquidity (200-500% increase) enabling largest position entry/exit. Avoid weekends showing 40-70% liquidity degradation and wider spreads.
Can I trade large positions on Polymarket
Yes in highly liquid markets showing $500,000-$5 million depth supporting $50,000-$200,000 positions with minimal 0.5-1.5% slippage. Presidential elections, major sports championships, Bitcoin price predictions, and Fed decisions provide sufficient depth. Avoid attempting large positions in Senate races, weather markets, entertainment predictions, or niche categories showing only $10,000-$50,000 depth creating catastrophic slippage.


