Laika AI
Last Updated
April 27, 2026

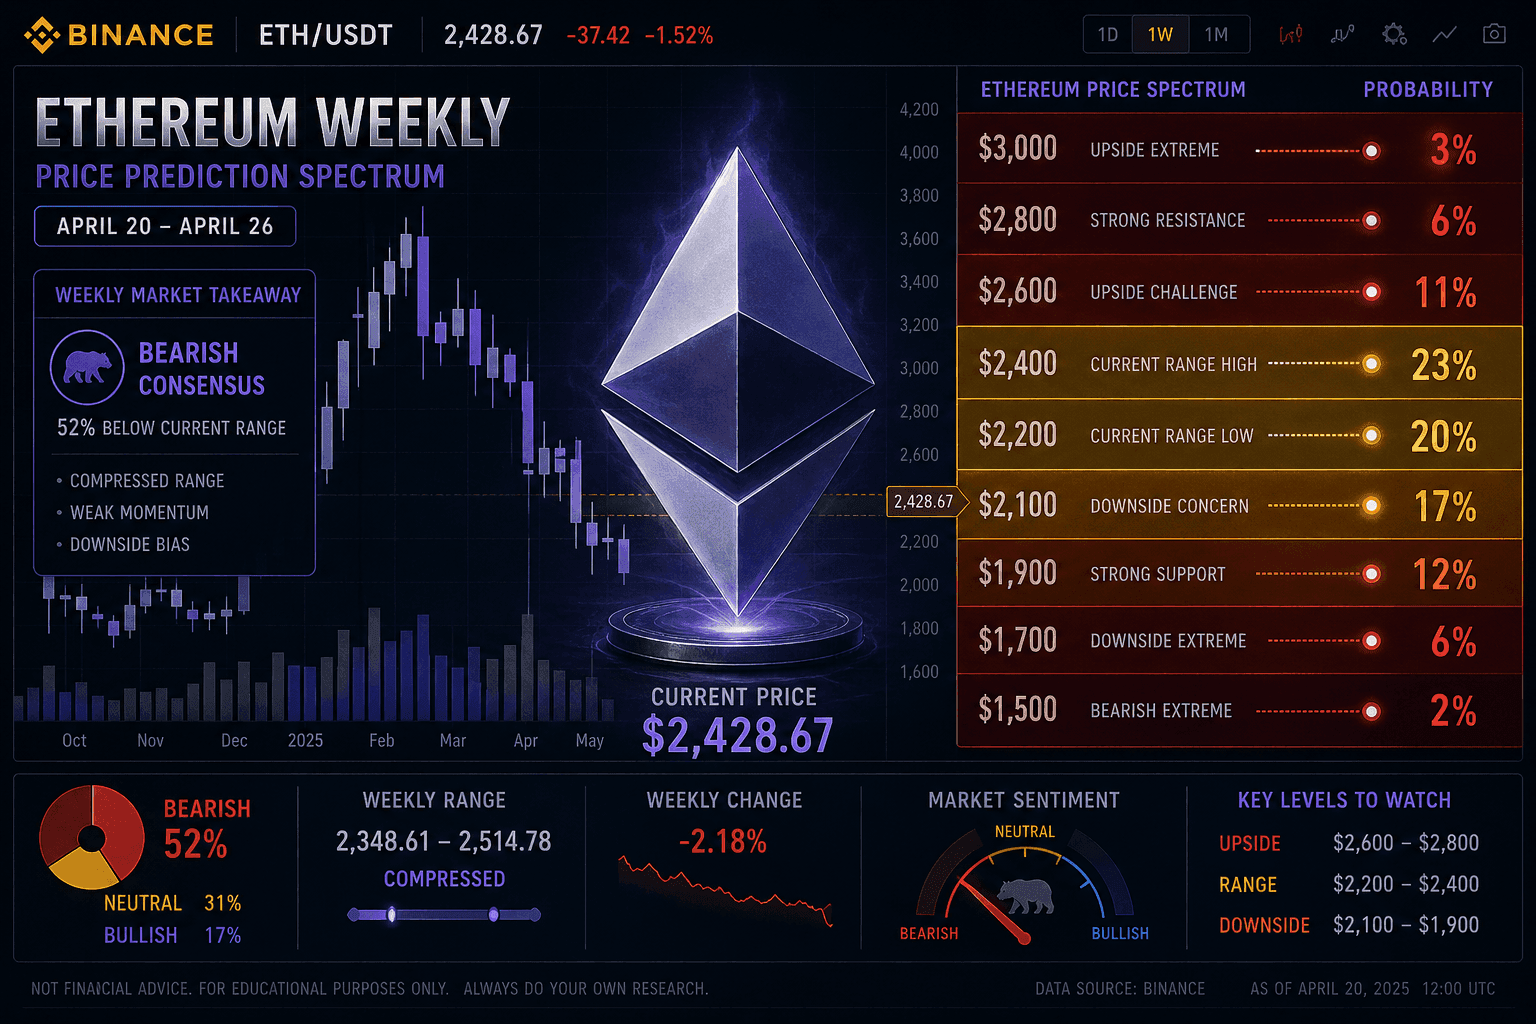
Weekly prediction markets covering Ethereum's price behavior from April 20 to 26, 2026, present a distribution in which every upside target from $2,800 through $3,000 draws negligible probability while downside thresholds toward $2,100 and below attract measurably higher odds, reinforcing the bearish weekly sentiment already visible in the April 23 intraday market distribution.
Where intraday prediction markets capture the market's assessment of what will happen within a single trading session, weekly markets aggregate that sentiment across a five- to six-day window, providing a broader read on directional conviction over a timeframe that allows multiple macro catalysts, technical developments, and sentiment shifts to influence outcomes.
The April 20 to 26 Ethereum weekly prediction market distribution extends the bearish picture established in the April 23 intraday data into a multi-day consensus that is even more informative about where the market believes Ethereum's price trajectory is headed. The uniform near-zero probability assigned to upside targets across a $200 range, from $2,800 through $3,000, indicates that traders are not pricing in any sustained recovery scenario over the course of the week, regardless of which specific price level serves as the recovery target.
The resolution mechanism for these weekly markets follows the same Binance ETH/USDT one-minute candle framework used in the daily markets, meaning that any threshold touched at any point during the specified week resolves to 'yes'. The fact that a five to six day window still produces 0.05% odds on the $3,000 target reflects how decisively the market has ruled out the scenario of Ethereum mounting a meaningful weekly recovery from its current position near $2,300.
No comments yet. Be the first!
The three upside thresholds under active market attention for the April 20 to 26 week each tell a slightly different but consistently bearish story. The $3,000 and $2,900 targets both sit at 0.05%, the minimum meaningful probability the market assigns to technically possible but practically inconceivable outcomes.
A $3,000 target would require approximately a 30% gain from Ethereum's current $2,300 level within a single week. For context, a move of that magnitude in a single week would rank among the largest weekly gains Ethereum has recorded in any market cycle, typically associated with breakthrough catalysts such as major protocol upgrades, landmark institutional adoption announcements, or dramatic macro reversals. The market is assigning that scenario the same probability it assigns to the $1,600 extreme downside threshold, effectively treating both as statistical noise rather than genuine possibilities.
The $2,900 target at 0.05% similarly rules out a scenario requiring approximately a 26% weekly gain. Even extending the generous end of Ethereum's historical weekly volatility distribution, a 26% gain would require conditions that the current macro environment shows no signs of producing within the specified timeframe.
The $2,800 threshold at 0.2% represents the only upside level where the market has assigned a probability meaningfully above the floor. While 0.2% remains extremely low in absolute terms, it is four times higher than the $2,900 and $3,000 odds, indicating a marginal market acknowledgment that a recovery to $2,800, requiring approximately a 21% weekly gain, is at least distinguishable from impossible in a way that higher targets are not. That differentiation suggests the $2,800 level occupies the outer edge of what even the most optimistic weekly scenario the market is willing to price could produce.
In contrast to the uniform near-zero probability across the entire upside range, the downside distribution for the April 20 to 26 week shows meaningful probability gradients that reflect genuine uncertainty about how far Ethereum could fall if the bearish scenario deepens.
The $2,200 threshold at 0.65% represents a scenario in which Ethereum falls approximately 4% from its current $2,300 level, a move that is well within the range of normal weekly volatility even in relatively calm market conditions. The 0.65% probability on a threshold this close to the current price might initially appear low, but it is more than ten times higher than the odds on the $3,000 upside target, reflecting the market's asymmetric confidence that downside risk is more credible than upside recovery.
The $2,100 threshold at 1% is the most significant single data point in the weekly distribution. A 1% probability on a threshold requiring approximately a 9% weekly decline represents a genuine tail risk assessment rather than noise. One in one hundred traders taking positions in this market is willing to back the scenario in which Ethereum loses nearly a tenth of its value within the April 20 to 26 window, a confidence level that warrants attention from risk managers and portfolio managers with ETH exposure.
The extreme downside thresholds tell the remainder of the downside story. The $1,600 level at 0.05% is treated with the same negligible probability as the $3,000 upside target, confirming that while the market is more bearish than bullish on a net basis, it is not pricing a catastrophic collapse scenario within the weekly timeframe.
The weekly prediction market distribution does not exist in isolation from the macro environment that has defined Ethereum's price trajectory through April 2026. The stagflation dynamic produced by Middle East conflict-driven energy shocks, the central bank policy paralysis between inflation fighting and growth support, and the persistent geopolitical risk premium across risk asset classes collectively create conditions under which Ethereum's growth-sensitive value proposition faces sustained headwinds.
Within the weekly window, the specific macro catalysts that could shift the distribution include any significant development in US-Iran peace negotiations ahead of the April 11 Pakistan talks follow-up, Federal Reserve communications on the rate path in light of the stagflation environment, and any Ethereum-specific developments around protocol activity or institutional flows. Absent a positive surprise in one of those categories, the weekly prediction market distribution's bearish lean is likely to persist through the resolution date, with the probability mass concentrated in the $2,200 to $2,400 range rather than at either extreme.