Laika AI
Last Updated
May 6, 2026

A new analytical resource called Crypto Rainbow Charts has launched at cryptorainbowcharts.com, offering traders a color-coded visual framework for assessing where the top 100 cryptocurrencies stand relative to their long-term price trends, with a design philosophy that prioritizes clarity and accessibility over data complexity.
The cryptocurrency market generates an enormous volume of price data across hundreds of assets and thousands of trading pairs, creating a signal-to-noise challenge that affects traders at every experience level. Technical analysis platforms have historically responded to that challenge by offering more data rather than less, layering indicators, oscillators, volume metrics, and order book visualizations into interfaces that require significant expertise to interpret and considerable time to navigate.
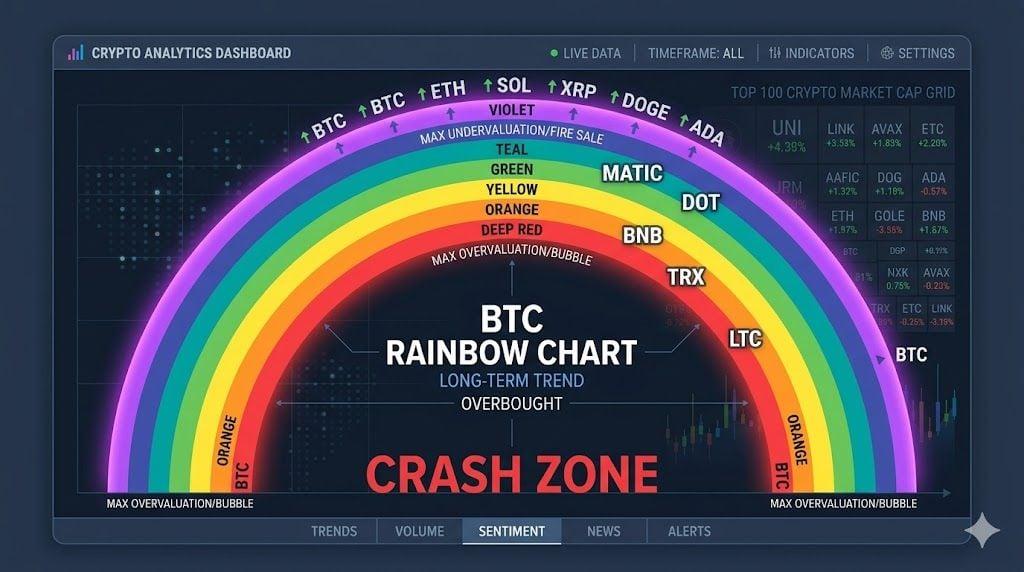
Crypto Rainbow Charts takes the opposite approach. By reducing the analytical output to a color-coded spectrum that maps price position relative to long-term trend bands, the tool allows a trader to assess market sentiment for any of the top 100 cryptocurrencies in the time it takes to glance at a chart. That speed and clarity are the product's defining design choices, made in deliberate contrast to the complexity that characterizes most competing analytical platforms.
The rainbow chart methodology is not new to Bitcoin analysis specifically, where similar color band frameworks have been used by the broader community for years to visualize Bitcoin's price relative to its logarithmic growth curve. Crypto Rainbow Charts extends that framework across the top 100 assets, applying consistent color-coded sentiment bands to a far broader slice of the market than previous implementations have covered.
No comments yet. Be the first!
The visual framework at the center of the tool uses a spectrum of colors, each corresponding to a specific price range relative to the asset's long-term trend, to communicate market sentiment without requiring the user to interpret numerical data. The color bands range from deep red at the lower extreme, indicating significant undervaluation relative to historical trend, through orange, yellow, and green in the middle ranges, to teal and violet at the upper extreme, indicating potential overvaluation or peak euphoria conditions.
A trader scanning the chart for a specific asset can immediately understand whether the current price represents a historically cheap entry point, a fair-value accumulation zone, a neutral hold position, or a level at which historical data suggests elevated risk of a correction. That immediate visual communication replaces the need to calculate percentage deviations from moving averages, interpret RSI readings, or cross-reference multiple timeframe analyses to arrive at a directional sentiment conclusion.
The long-term trend focus embedded in the rainbow band methodology encourages a different type of decision-making than short-term price chart analysis promotes. When traders view price in relation to multi-year trend bands rather than daily or weekly candlestick patterns, the market signal they receive is oriented toward accumulation and distribution decisions rather than momentum trading entries and exits. That temporal reframing is one of the tool's most valuable contributions to retail trader behavior, nudging users toward the kind of patient, trend-aware positioning that has historically produced better outcomes than reactive short-term trading.
The decision to build the tool around the top 100 cryptocurrencies rather than focusing exclusively on Bitcoin or a small set of major assets significantly expands its utility for traders with diversified portfolios or active altcoin strategies. The top 100 by market capitalization covers the vast majority of liquid crypto trading volume, encompassing layer-1 blockchains, DeFi protocol tokens, stablecoins, AI sector tokens, and the major exchange and infrastructure tokens that represent the most actively traded segments of the market.
Having rainbow chart visualizations available for all 100 assets simultaneously enables a portfolio-level scan that would require significant time to replicate through individual asset analysis on conventional charting platforms. A trader evaluating their overall crypto exposure can quickly identify which holdings are in historically extended sentiment zones and which are near long-term trend support, informing rebalancing decisions with visual data that takes seconds to process.
The accessibility benefit is particularly pronounced for newer traders who are building their understanding of market cycles and long-term trend analysis. Rainbow charts provide an entry point into technical analysis that does not require familiarity with indicator parameters, timeframe selection, or the interpretation of conflicting signals across different analytical frameworks. The color-coded output delivers the conclusion that more complex analysis would eventually reach in a format that requires no prior technical analysis knowledge to understand.
The arrival of Crypto Rainbow Charts coincides with one of the more complex macro environments the cryptocurrency market has navigated in recent years. The combination of geopolitical risk from the ongoing Middle East conflict, stagflation concerns driven by energy price shocks, central bank policy uncertainty, and asset-specific developments across the top 100 has created a market in which a long-term perspective is particularly valuable as a counterweight to the noise generated by short-term volatility.
In environments characterized by significant intraday price swings driven by macro headlines rather than fundamental changes in asset quality, tools that anchor analysis to long-term trend frameworks help traders resist the impulse-driven decisions that volatile markets provoke. A trader who can see that an asset has moved from a historically overvalued rainbow band into a neutral or undervalued zone during a macro-driven sell-off is better equipped to evaluate whether the sell-off represents a buying opportunity or a confirmation of deteriorating fundamentals than one relying solely on recent price action.
The 30-day access available through the platform, with no barrier to entry, allows traders across all experience levels to evaluate the tool's utility within their existing analytical workflow without financial commitment, a distribution approach that prioritizes adoption breadth over immediate monetization and reflects confidence in the product's utility once traders have experienced it in a live market environment.